Stocks Bloom In May

BigNumber_Image 6.02.25

Consider a goals-based investment perspective going into summer


The old adage “April showers bring May flowers” proved true on Wall Street this year.

After falling 0.7% in April, the S&P 500 gained 6.3% last month, marking the index’s best May return since 1990 and its best monthly return since November 2023 (see the chart). Investors were heartened by a court ruling that could force President Trump to reduce or rescind his tariffs on other nations, as well as quarterly earnings results showing that the outlook for corporate profit growth remains healthy.

Another old adage, the one urging investors to “sell in May and go away” until November, would not have worked out well so far in 2025.

S&P 500 Monthly TR Returns (Jan. 2023 – May 2025)


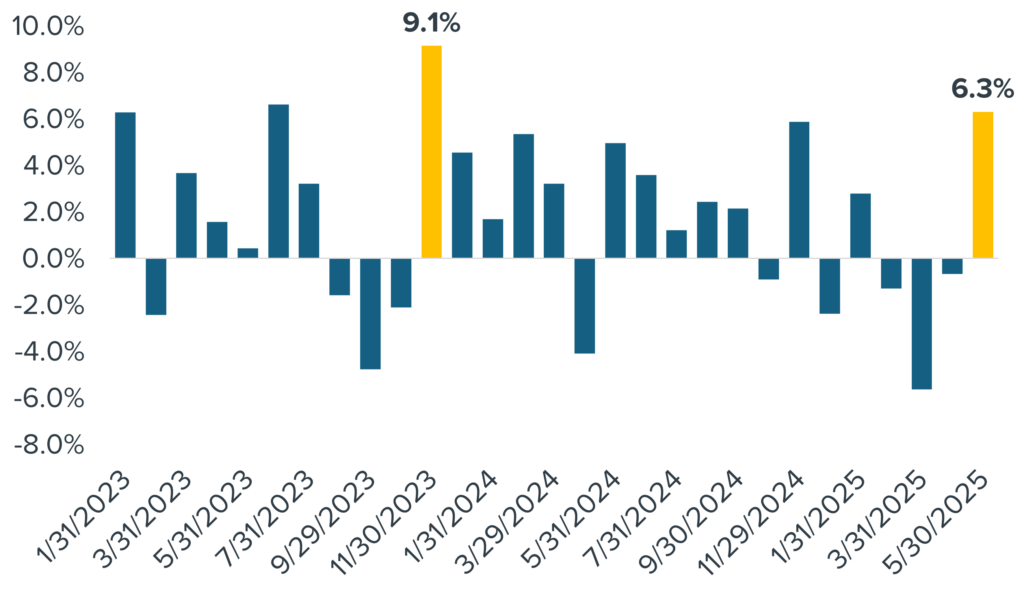
Source: Bloomberg, calculations by Horizon Investments, data as of 06/02/25. Indices are unmanaged and do not have fees or expense charges, and dividend reinvestment makes no assumption about taxes, both of which would lower returns. It is not possible to invest directly in an unmanaged index.


Where do we go from here? Keep in mind that stock market returns during the “go away” summer months have been quite strong in recent years, with the S&P 500 averaging close to 7% over the three months from June through August since 2020. That said, it’s possible that some assets may have rallied too far, too fast lately. Also, the upcoming deadline for a tariff deal between the U.S. and Eurozone could weigh on stocks this summer.

Our thought: Skip the rules of thumb aimed at timing the markets, especially if they rhyme. Instead, consider helping clients establish personalized goals-based strategies designed to capture potential opportunities while effectively managing risks, and encourage them to stay focused on the longer-term objectives of their plan.

The S&P 500 Total Return Index is a total return index that reflects both changes in the prices of stocks in the S&P 500 Index as well as the reinvestment of the dividend income from its underlying stocks. References to indices, or other measures of relative market performance over a specified period of time are provided for informational purposes only. Reference to an index does not imply that any account will achieve returns, volatility or other results similar to that index. The composition of an index may not reflect the manner in which a portfolio is constructed in relation to expected or achieved returns, portfolio guidelines, restrictions, sectors, correlations, concentrations, volatility or tracking error targets, all of which are subject to change. It is not possible to invest directly in an index. Information obtained from third party sources is believed reliable but has not been vetted by the firm or its personnel.
The investments recommended by Horizon Investments are not guaranteed. There can be economic times when all investments are unfavorable and depreciate in value. Clients may lose money. This commentary is based on public information that we consider reliable, but we do not represent that it is accurate or complete, and it should not be relied on as such. The opinions expressed herein are our opinions as of the date of this document. These opinions may not be reflected in all of our strategies. We do not intend to and will not endeavor to update the information discussed in this document. No part of this document may be (i) copied, photocopied, or duplicated in any form by any means or (ii) redistributed without Horizon’s prior written consent. Forward-looking statements cannot be guaranteed. Other disclosure information is available at www.horizoninvestments.com.
Horizon Investments and the Horizon H are registered trademarks of Horizon Investments, LLC
©2025 Horizon Investments, LLC.
You are now leaving this website to go to HorizonMutualFunds.com